
These are some of the projects that I made. Some are from my PhD. Some were mandatory for my courses, others just for fun or in my curious mood.
High dimensional optimization for penalized linear models with interactions using graphics card computational power
Master thesis internship on the Elastic-Net estimator for the linear model with interactions using GPU acceleration. Internship under the supervision of Benjamin Charlier and Joseph Salmon. Based on the thesis work of Florent Bascou. Git Repo
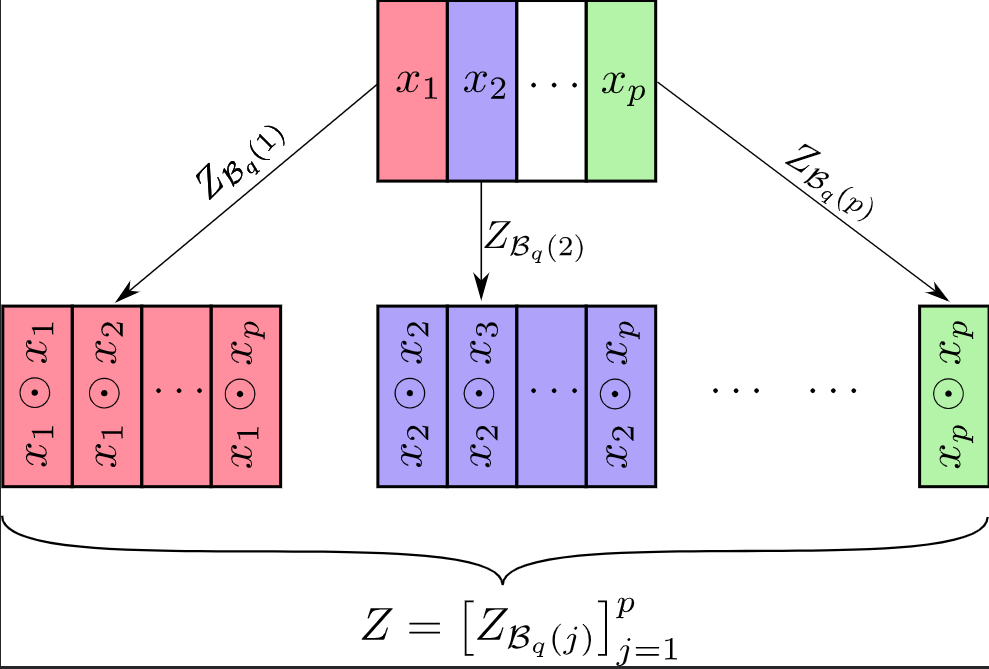
Memory usage with GPU was a big part of this work. Dataset dimensions quickly lead to memory errors. Interactions thus needed to be computed on the fly, but using too little memory is not efficient for GPU computation.
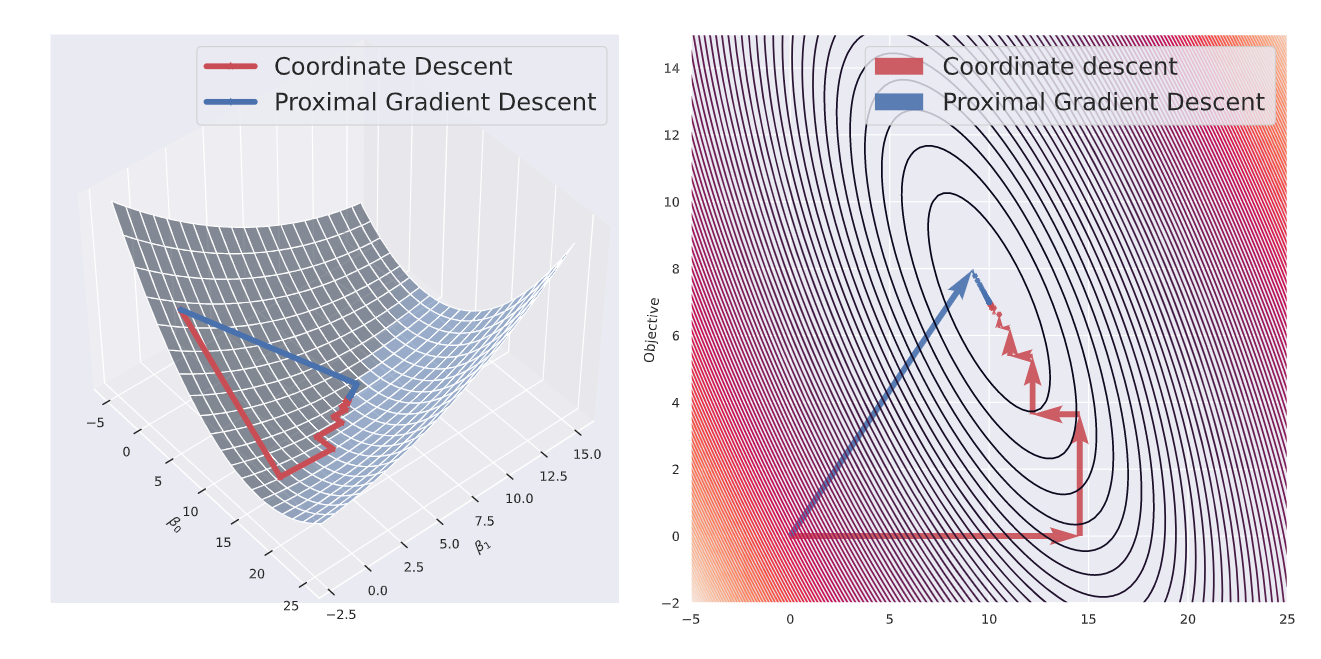
Comparison between Gradient descent and Coordinate descent. The step size choice lead to developpements of the Lanczos method in order to have quickly a good estimate of the Lipschitz constant.
Application to Genomics data.
Solving definite positive systems and optimal transport fields with KeOps library
Internship during the master with Benjamin Charlier. The goal was to implement scipy’s Fortran implementation of the conjugate gradient descent in KeOps with time and memory optimization. We also took examples from the optimal transport field to explore the efficiency of the library.
[Report]
Chaoseverywhere package
The main goal of this project was to create a fully-documented Python package that allows the user to visualization the link between the bifurcation diagram of the logistic map and the Mandelbrot set. Software Development group project. Made with Coiffier Ophélie and Gaizi Ibrahim.
Click here to go see the doc (don’t forget to take a look at the galleries)!

Use of the Mayavi library to make 3D visualizations.
When the bifurcation diagram and the Mandelbrot set collide… That makes Chaoseverywhere.
Let the user apply any transformation on the Mandelbrot sequence.
Radio-surgery: bachelor degree final project
Bachelor degree project with Clémence Roumier and Caroline Tresse on the skeletonization of a shape and how to cover the most of it with predefined-sizes rays. Methods based on Mathématiques et technologie by Yvan Saint-Aubin and Christiane Rousseau (Springer 2009).
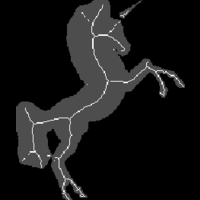
The first step: get the morphological skeleton of a shape.
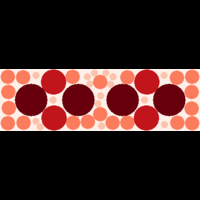
Try the algorithm on a simple shape first… more secure especially if its related to surgery.
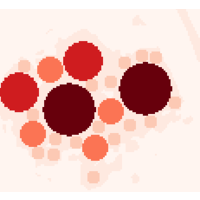
We can then apply the algorithm to more complex shapes: eg a cerebral tumor.
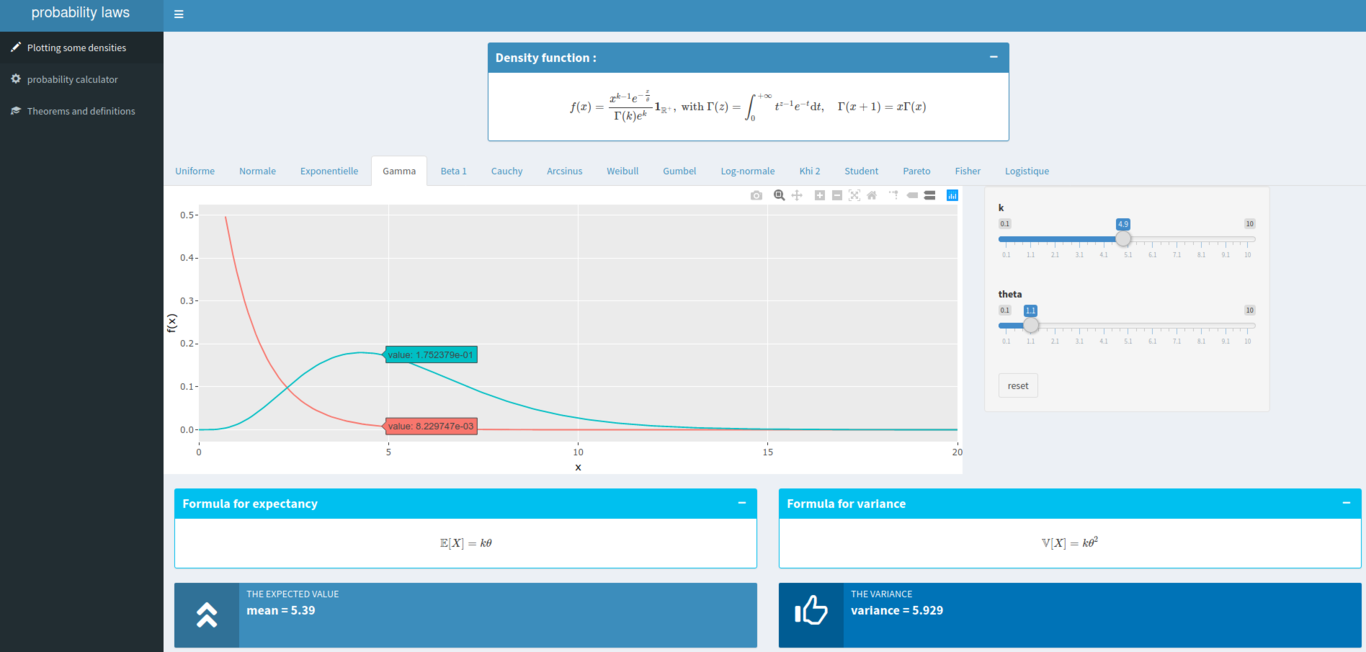
Rshiny app for interactive probabilities
R-Shiny app to visualize probability distributions, make some probability computations easily and interactive dictionnary for a general bachelor-level theorems and definitions in probabilities and statistics. This was mainly to discover by my self the interactivity with the R programming and make it useful.
If you prefer to run it locally, open RStudio or any alternative and enter in the console the following lines. You might need to install a few packages first.
# install.packages(c("shiny", "plotly", "rsconnect", "shinydashboard"))
library(shiny)
runGitHub( "proba_shiny_app", "tanglef")
Due to shinyapps.io time and memory limitations per-months, the app might not be always available, hence the local run option.